Single Project View Help Guide
Here is a quick overview of the projects interface.

Project Settings

Here you can edit your project's settings:
Project Name - Click to edit and give your project a new name.
Type - Change the project type - either Regular or ORM.
Alerts - Reset the Alerts for all keywords and domains/urls and tags within your project (Warning: this overrides all previous custom settings).
Delete - Deletes the current project.
Latest Positions

Latest Positions
Project Stats
Here is a breakdown of the Project Stats from the lefthand side of the interface:
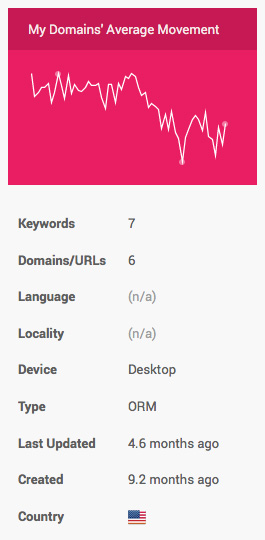
Sparkline - The first thing you'll see is a sparkline chart of your Domains/URL's Average movement within your projects. This only showcases your domains/urls which are tagged as "positive". If a domain/url is tagged another tag their aggregated data will not be included in this sparkline.
Keywords - The amount of keywords within this project.
Domains/URLs - The amount of domains/urls within this project.
Language - The particular language of this project (default = no language selected).
Locality - The location this project is set to crawl SERPs from (example: "Chicago, IL").
Type - The default type of project this is (choices are Regular or ORM).
Last Updated - The last time new data was entered into this project.
Created - How long ago this project was created.
Country - What Country this project is targeting.
Quick Add
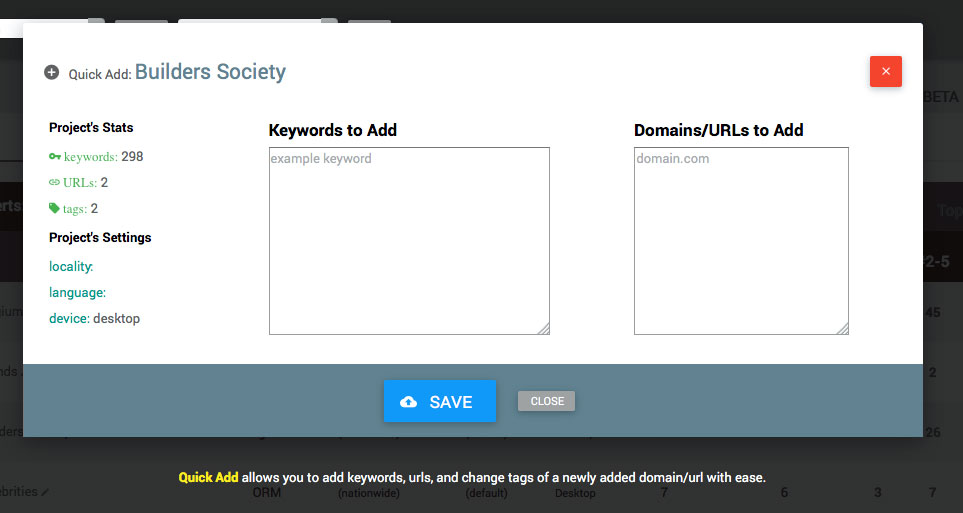
From this interface you can quickly add new keywords and/or domains/urls to the current project by clicking on the Keywords & Domains/URLs button.
Export
There are currently 5 types of CSV Exports :
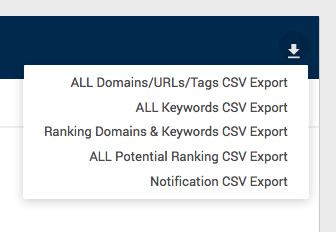
- All Domains/URLs/Tags CSV Export - This simply exports ALL your domains/urls/tags. No ranking factors.
- All Keywords CSV Export - This simply exports ALL your keywords. No ranking factors or anything else.
- Ranking Domains & Keywords CSV Export - This is a clean export of just keywords and their domains/urls which are ranking. Keywords and/or domains/urls which do not have rankings are not included.
- All Potential Rankings CSV Export - This exports a CSV file which contains ALL keywords and their domains/urls in a cross referenced manner. Keywords which are not rankings will appear here - since you want EVERYTHING.
- Notification CSV Export - The most recent 1,000 notifications about this particular project.
Project Tabs
We created different tabs to view various data about your projects. Here is a break down of each Tab's functionality. (Please note, this section is a work in progress and there are new features being added rapidly since we are looking to continue diving deeper into your data. If you see something within the interface that is not explained yet here, simple let us know and we'll create a tutorial for it.)

Insight
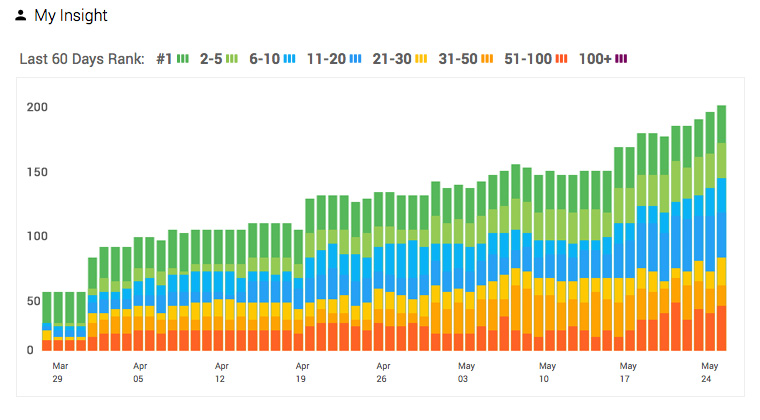
The Insight tab has a stack chart ( ) which showcases your overall rankings for the last 60 days. The rankings are represented by the different colors for the top 100+ positions:
#1 = dark green
#2-5 = lime green
#6-10 = cyan maybe
#11-20 = blue
#21-30 = amber
#31-50 = orange
#51-100 = deep orange
#100+ = Dark Purple
My Domains/URLs/Tags
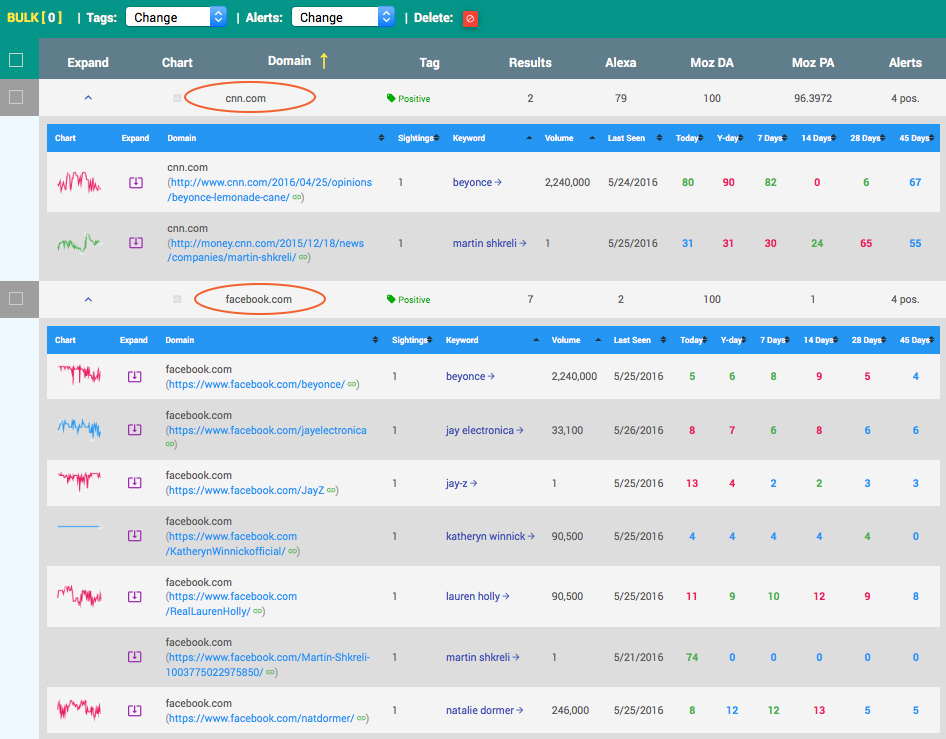
The My Domains tab showcases a display of the domains/URLs/tags (simplified as "domains" going foward) you have created within this project. You can then expand each row of your data to see an organized chart of the keywords that domain is ranking for. This helps you organize what you are looking at for quickly researching what's going on with a particular domain when you have multiple domains within a project and only want to look at some of them.
In the left-hand example we are seeing the cnn.com domain has 2 rankings for the keywords within this project. We can also see further down the facebook.com domain holds 7 keywords ranking, and their positions.
The URL you are shown is the highest ranking URL from within the SERPs of that keyword. To see ALL the URLs ranking you can click on the "Expand" icon to see a detailed SERP graph.
Sightings Column
There is a special column called "Sightings" which was recently added. This column will count how MANY times that domain was seen within the top 100 rankings for that particular keyword.
This helps tremendously with finding cannibalization of your rankings, which you can then fix and increase your rankings higher. In a situation where the keyword is your brand and there are sitelinks for example you'll see the total amount of sitelinks and any other pages within the SERPs from your domain.
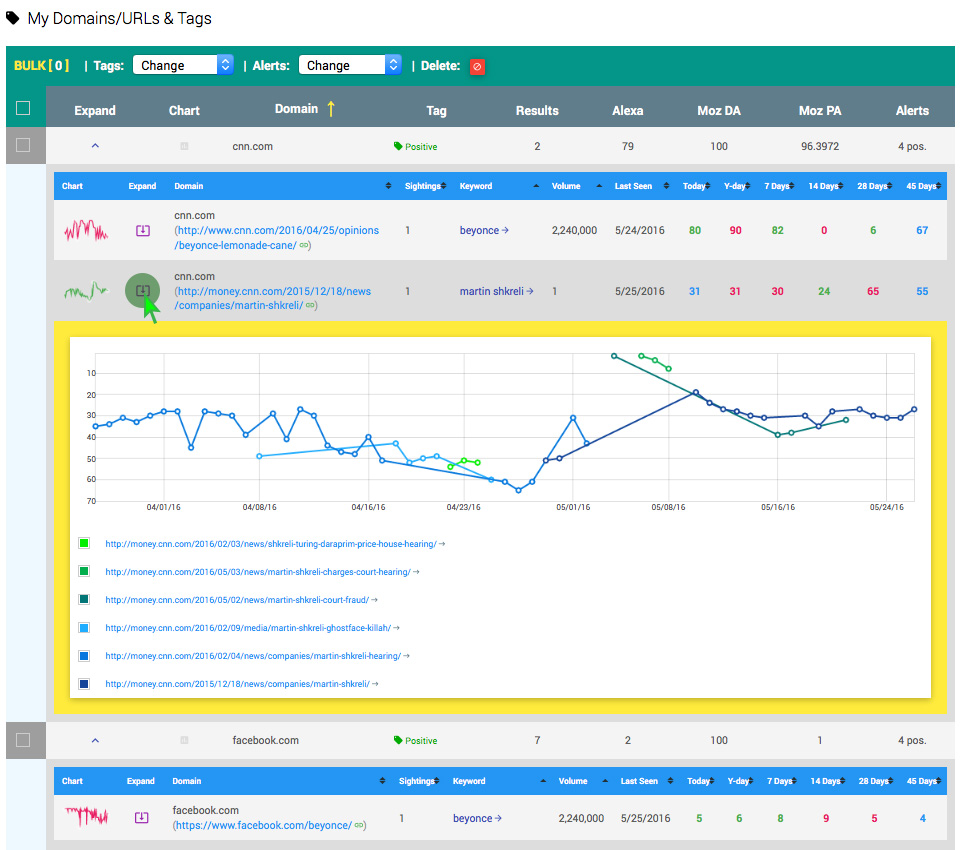
Expand Row
When you click on the "Expand" icon of a row, you will be shown a live SERP chart similar to the "Keyword Dashboard" chart, except it will only show your domains' rankings for this keyword and not everything else.
In the left hand example you can see there are 6 URLs from CNN which have ranked at various times for the keyword "Martin Shkreli" (multiple URLs from the same domain can rank on the same day within the SERPs, you will be shown all of them).
My Keywords

The My Keywords tab showcases your project's data organized by Keywords. Here you can expand each row to see which one of the domains you are watching (yours or your competitors) are ranking for on a keyword basis.
In the lefthand example there are 7 keywords being tracked. We have expanded the "Jay-Z" keyword to see which one of the properties we are monitoring in this project is ranking within that keyword's SERPs. We can see all the domains ranking and their respective positions. You can also expand this as well to see further live SERP data.
In the example you'll notice there are 16 different twitter URLs ranking in the SERPs for this keyword according to the Sightings column. As well there are 2 soundcloud.com URLs ranking right now in the same SERPs.
Notifications

The Notification tab is here to help you get really organized with your projects. You are able to see the alerts that pertain only this particular project so you can get a quick overview of what has been happening within the last 1000 notifications.
You can export this data as well.
This is the last of the sequential Quick Start Guides. We'll be making adjustments to each guide based off of your feedback and will inform everyone once new interface guides are made available for the new features coming out.
Get in touch or create an account.